LaTeX templates and examples — Charts
LaTeX can be used to produce a variety of different charts and diagrams, including: flowcharts, gantt charts, pie charts, branching and decision trees, family trees, histograms, bar charts and more. If you're looking for a particular type of chart that isn't featured here, please let us know, or submit your own example to the gallery.
Recent
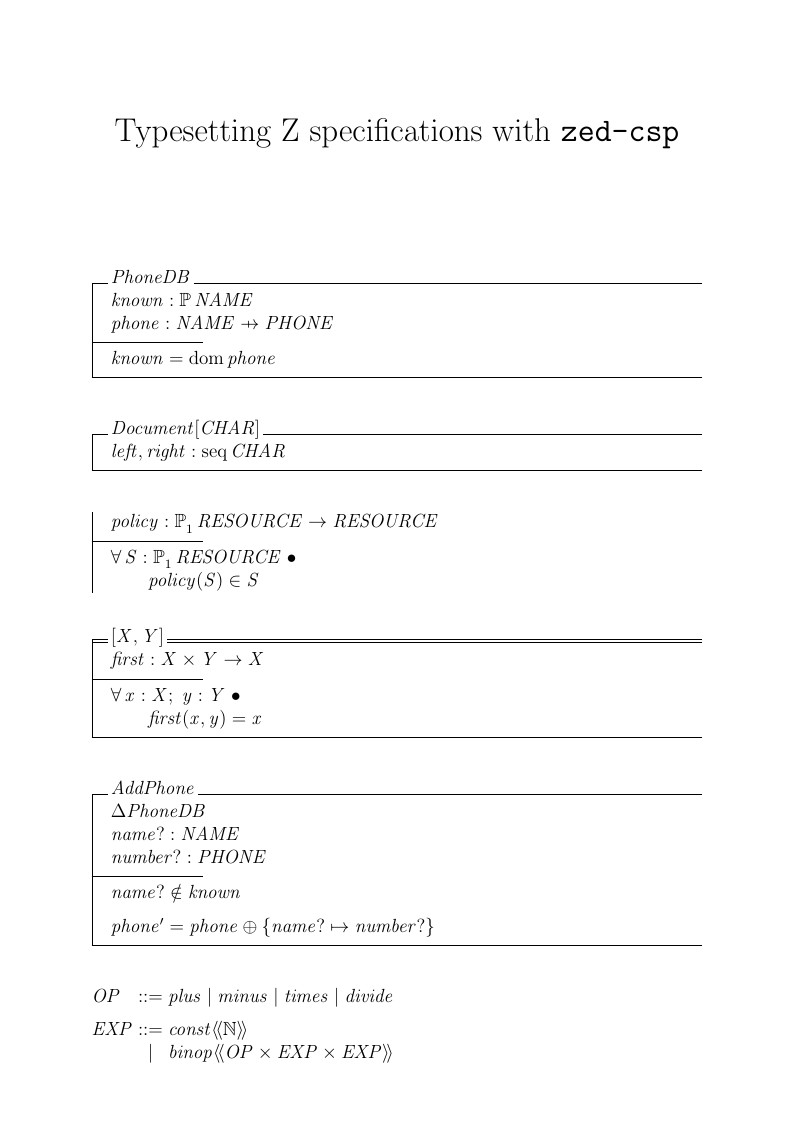
Examples from the zed-csp documentation.
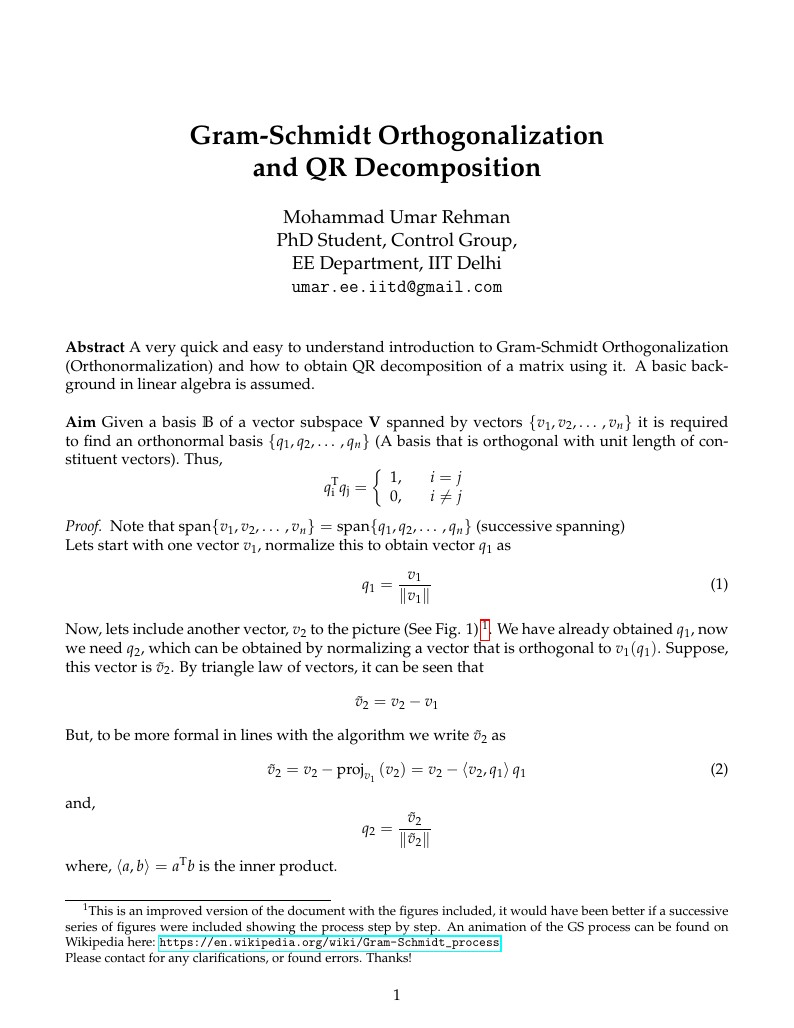
A very quick and easy to understand introduction to Gram-Schmidt Orthogonalization (Orthonormalization) and how to obtain QR decomposition of a matrix using it.

j'aimes les math par une courbe paramétrique de cœur !
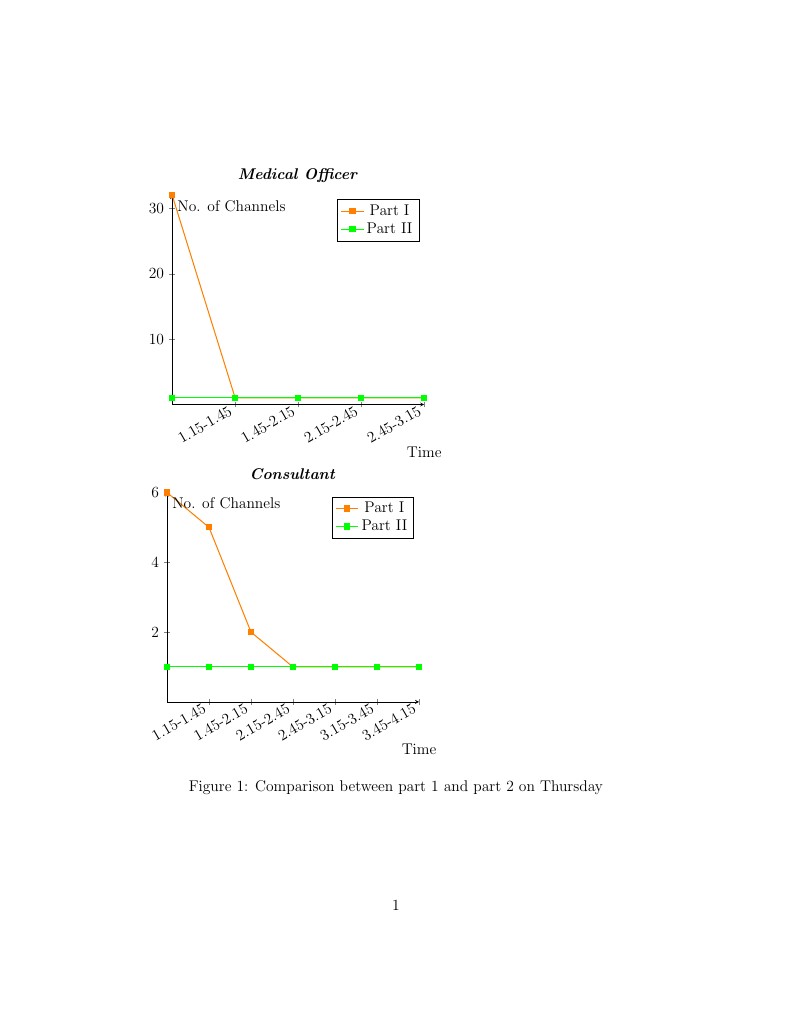
LaTeX codes for line charts
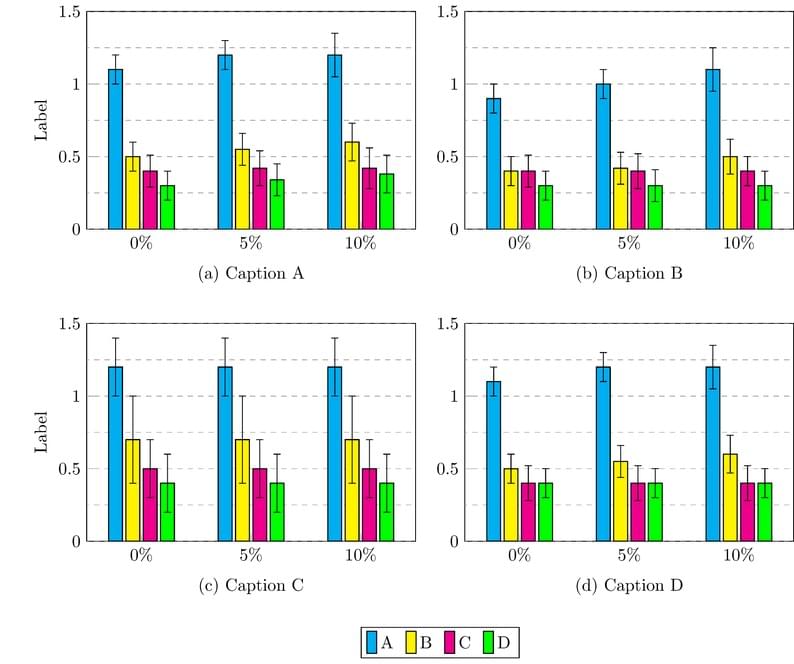
Create a groupplot of barcharts where the data is read from text files using the PGFPlot package.
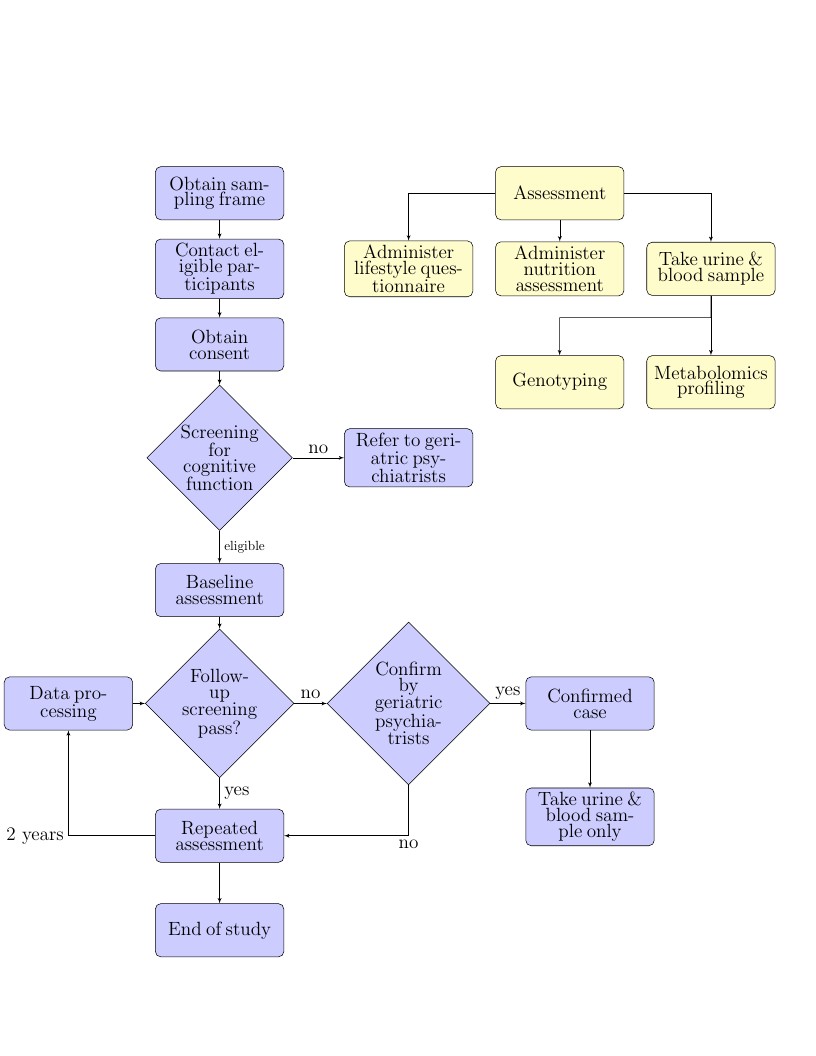
tikz flowchart of an epidemiology study
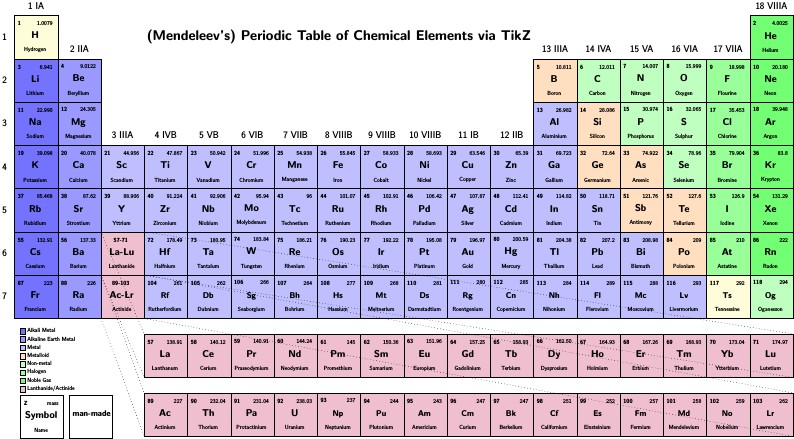
Copyright 2009 Ivan Griffin This work may be distributed and/or modified under the conditions of the LaTeX Project Public License, either version 1.3 of this license or (at your option) any later version. The latest version of this license is in http://www.latex-project.org/lppl.txt and version 1.3 or later is part of all distributions of LaTeX version 2005/12/01 or later. This work has the LPPL maintenance status `maintained'. The Current Maintainer of this work is Ivan Griffin This work consists of the files periodic_table.tex
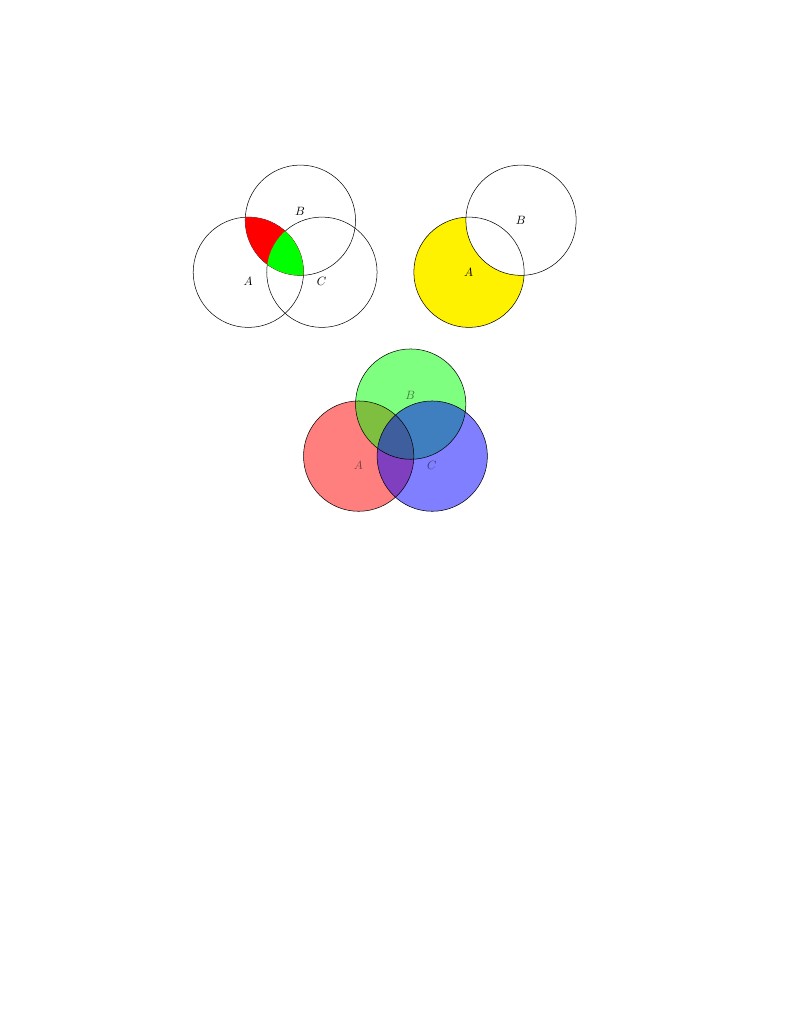
Venn Diagrams in LaTeX
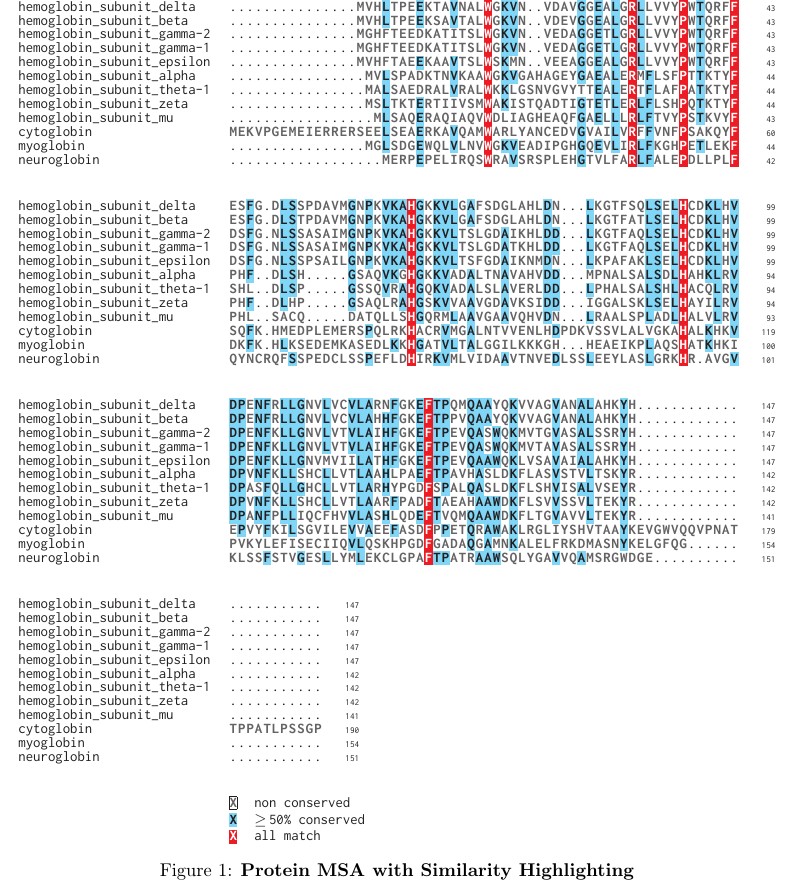
This template is used to create standalone, publication-quality figures for multiple sequence alignments using the texshade package.
\begin
Discover why over 25 million people worldwide trust Overleaf with their work.